In today’s interconnected world, ensuring your services and applications are running smoothly is more important than ever. Uptime Kuma offers a simple yet powerful solution for monitoring the uptime and performance of your services using Docker.
This blog post will guide you through setting up Uptime Kuma on Docker, allowing you to monitor your home network with ease.
Why Choose Uptime Kuma?
Uptime Kuma provides a user-friendly interface and flexible monitoring capabilities for HTTP(s), TCP, and other services.
By leveraging Docker, you can deploy Uptime Kuma on your home network effortlessly, ensuring continuous visibility into the health of your applications.
Prerequisites Before we begin, make sure you have the following:
Docker Desktop installed on your system. Basic understanding of Docker concepts and commands. Command Prompt or PowerShell for executing Docker commands.
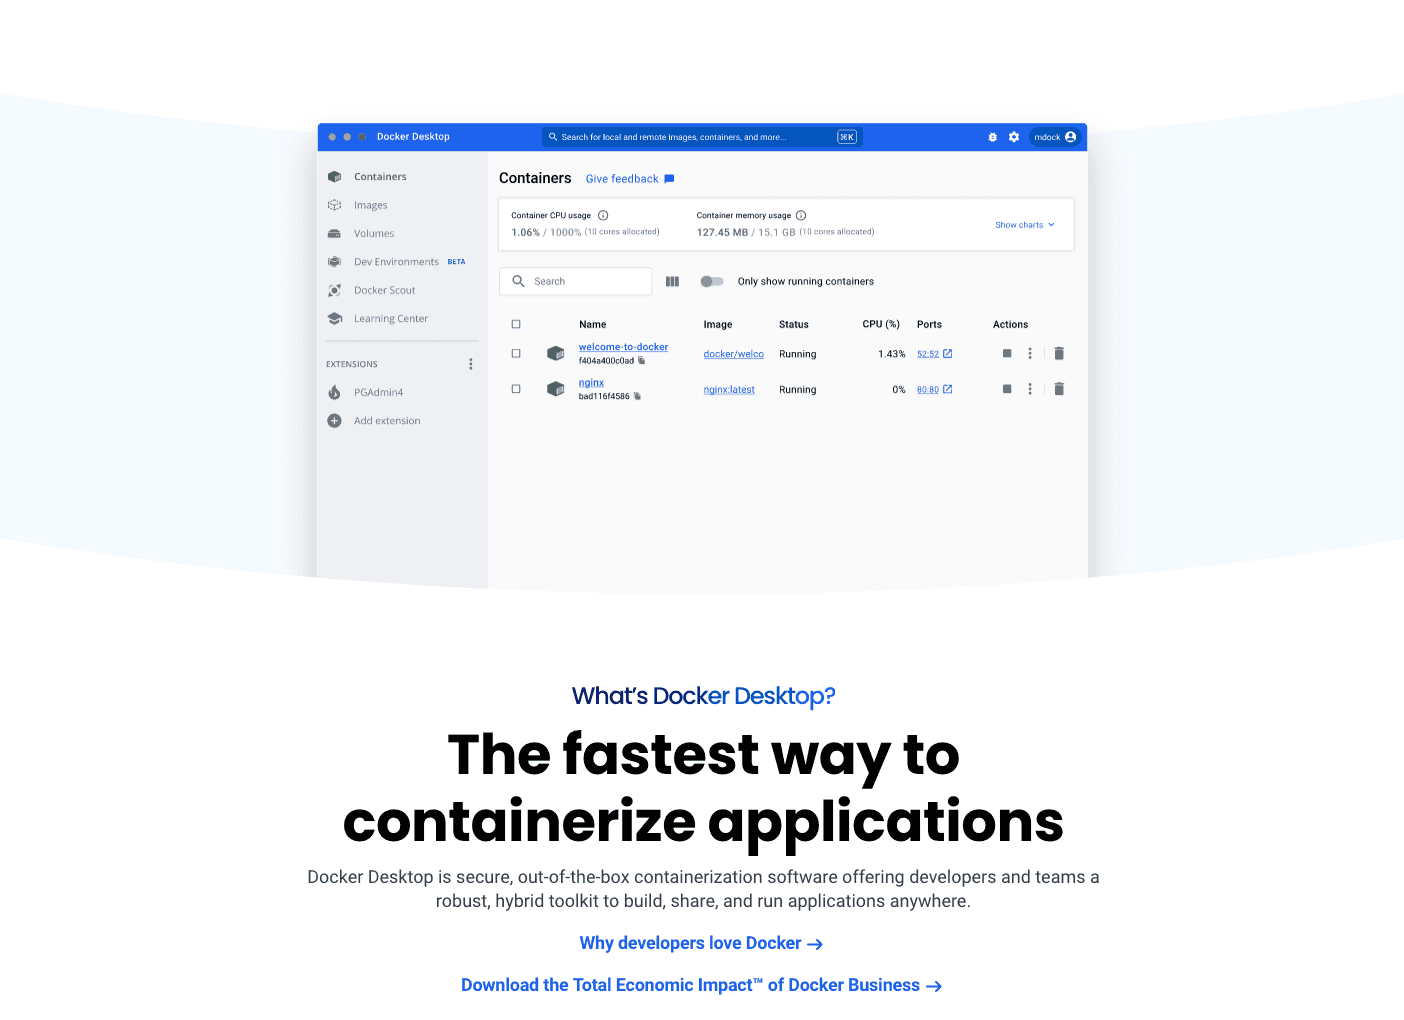
Step 1: Install Docker Desktop If Docker Desktop is not already installed, you can download it from the official Docker website and follow the installation instructions for your operating system.
Step 2: Create a Directory for Uptime Kuma Data Open Command Prompt or PowerShell on Windows or Terminal on Linux & macOS and create a directory to persist Uptime Kuma’s data:
For Windows
mkdir C:\UptimeKumaDataFor Linux & MacOS
mkdir UptimeKumaDataStep 3: Create the Docker Compose File
Create a docker-compose.yml file in your preferred directory (e.g., C:\UptimeKuma) with the following content:
For Windows
notepad docker-compose.ymlFor Linux & MacOS
nano docker-compose.yml
```***
Enter the following & save.

```bash
version: '3.8'
services:
  uptime-kuma:
    image: louislam/uptime-kuma:latest
    container_name: uptime-kuma
    ports:
      - "3001:3001"
    volumes:
      - ./uptime-kuma-data:/app/data
    restart: always
volumes:
  uptime-kuma-data:
Step 4: Start Uptime Kuma Container
Navigate to the directory containing your docker-compose.yml file and execute the following command to start the Uptime Kuma container:
docker-compose up -dThis command pulls the latest Uptime Kuma image from Docker Hub and starts it in detached mode (-d).
Step 5: Access Uptime Kuma Dashboard
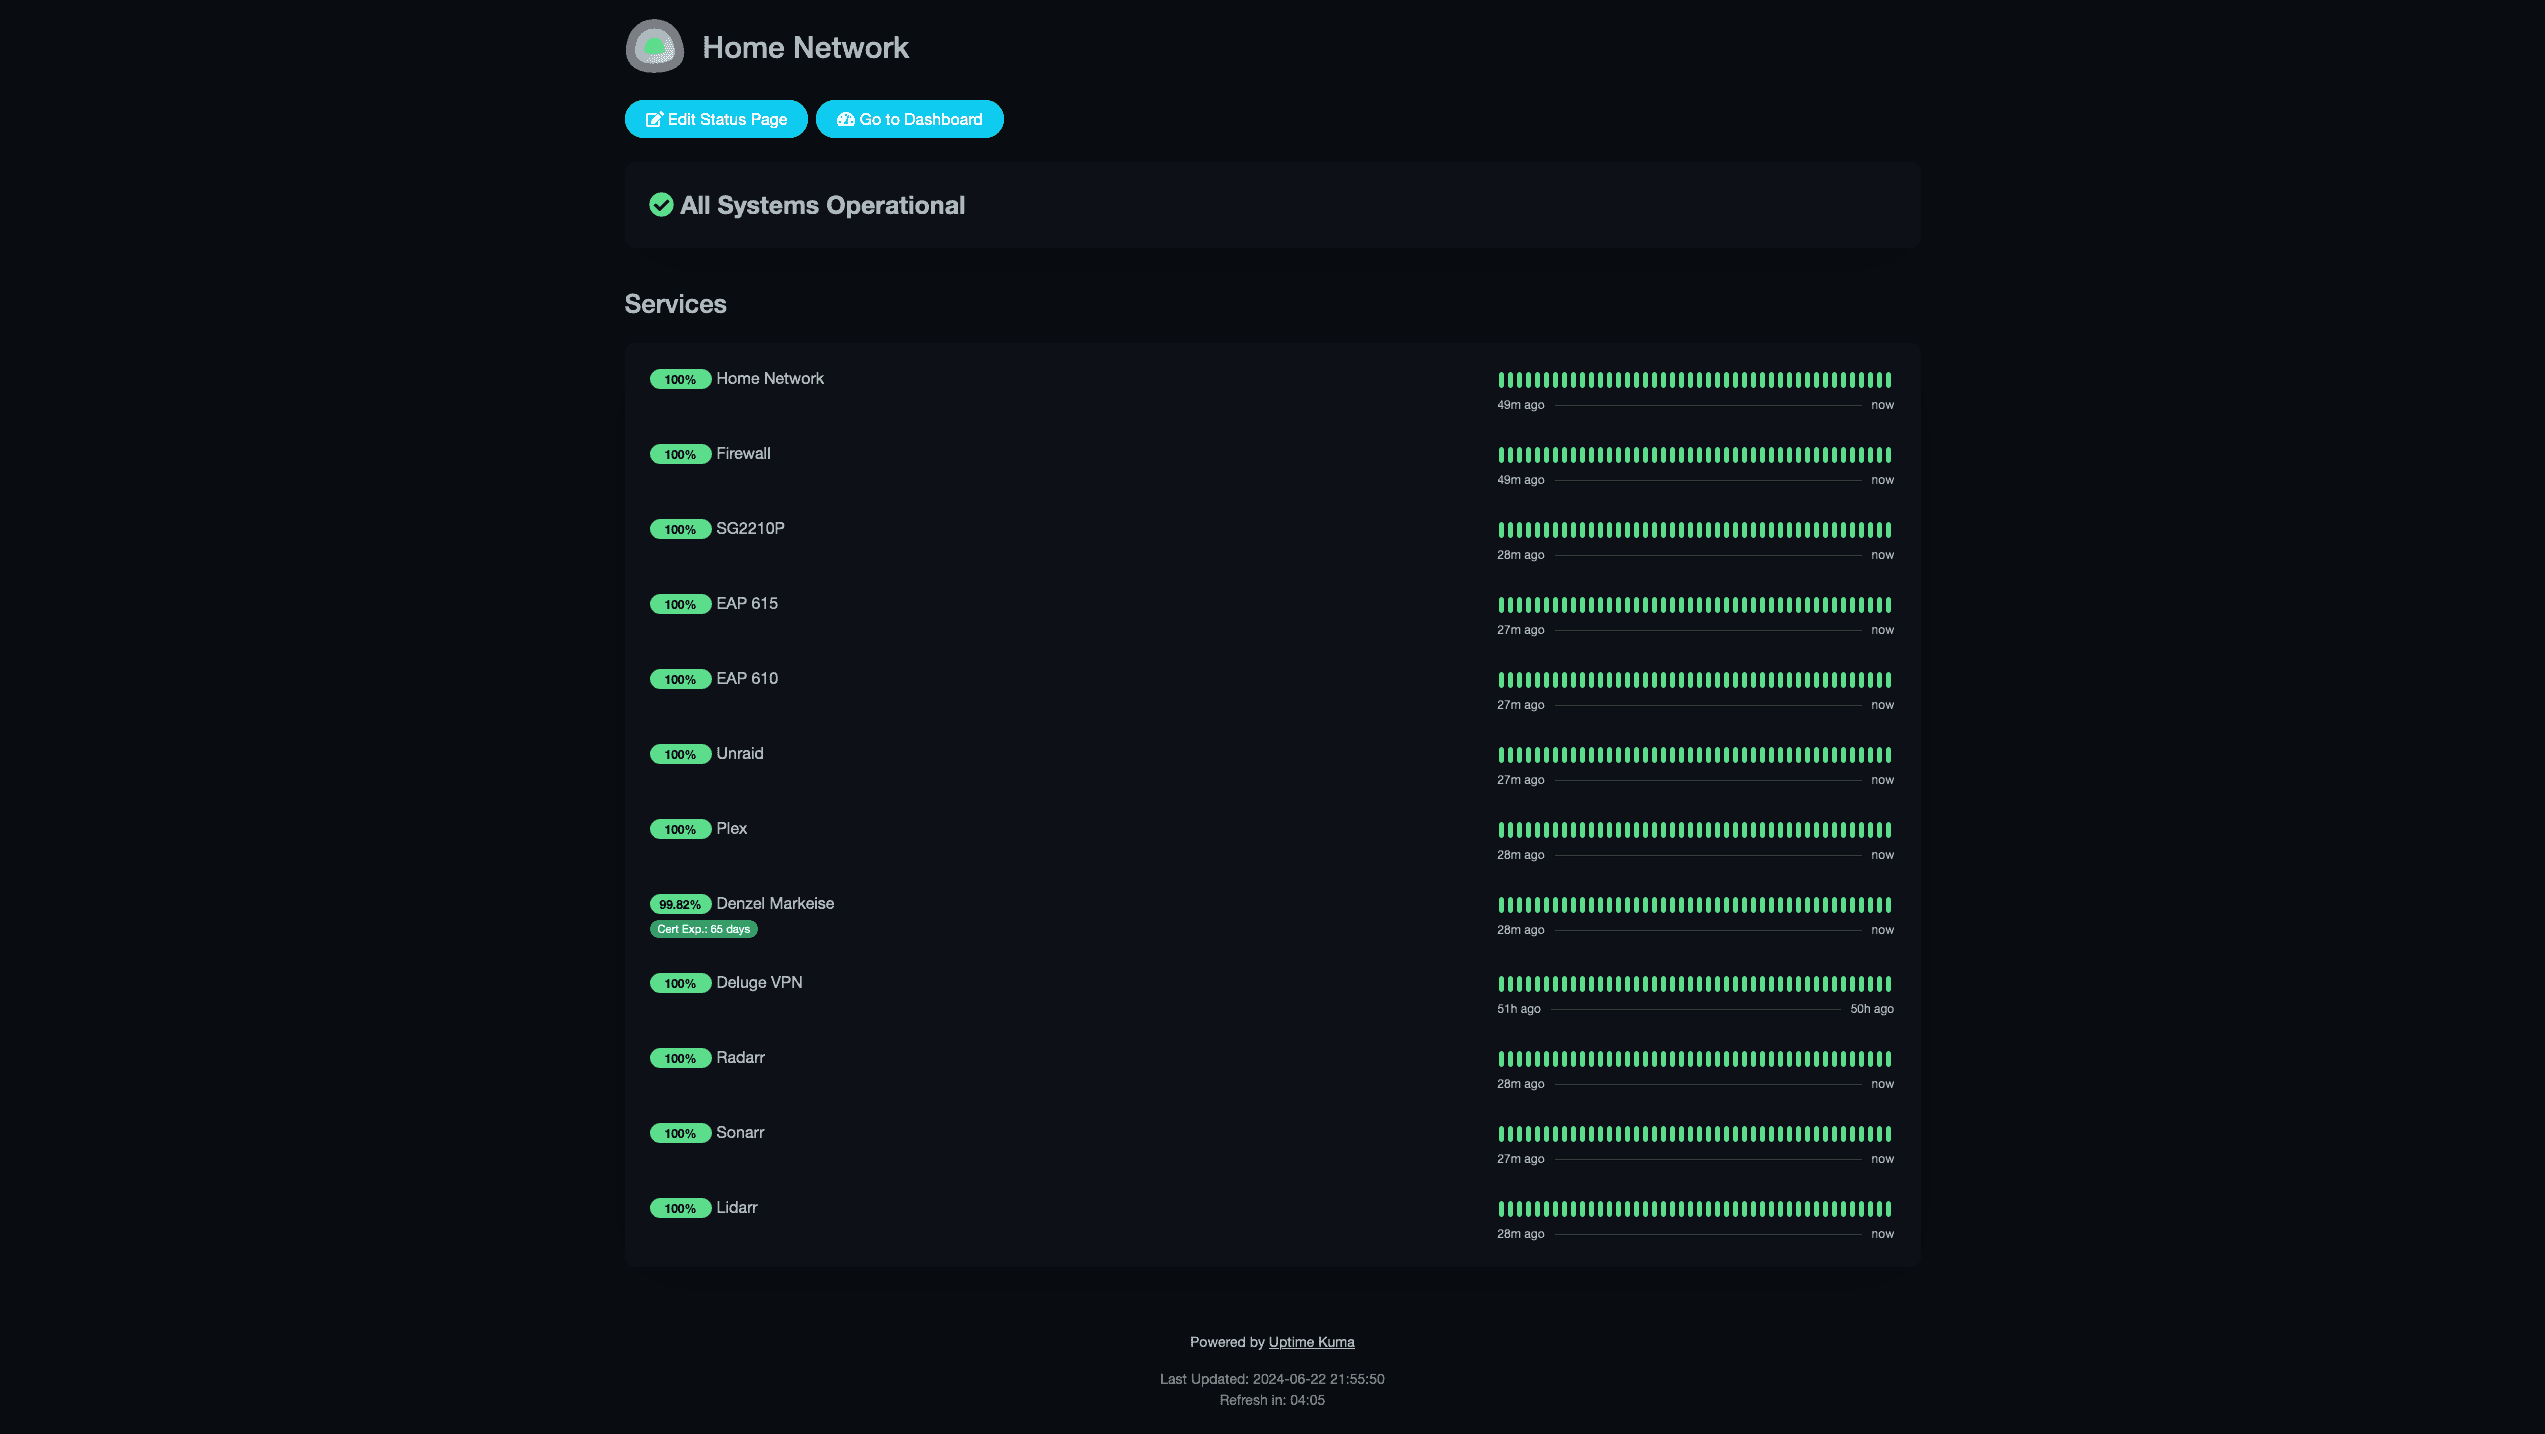
Open your web browser and navigate to http://localhost:3001 to access the Uptime Kuma dashboard. You should see the login screen where you can set up your account and start using Uptime Kuma.
Step 6: Customize Monitoring
Uptime Kuma allows you to monitor various services. You can add monitors for HTTP(s), TCP, and other protocols as per your monitoring requirements. Follow the instructions within the Uptime Kuma dashboard to configure your monitors.
Monitoring HTTP(s) Services
If you have websites or web applications, you can set up HTTP(s) monitors to check their availability and performance.
Example:
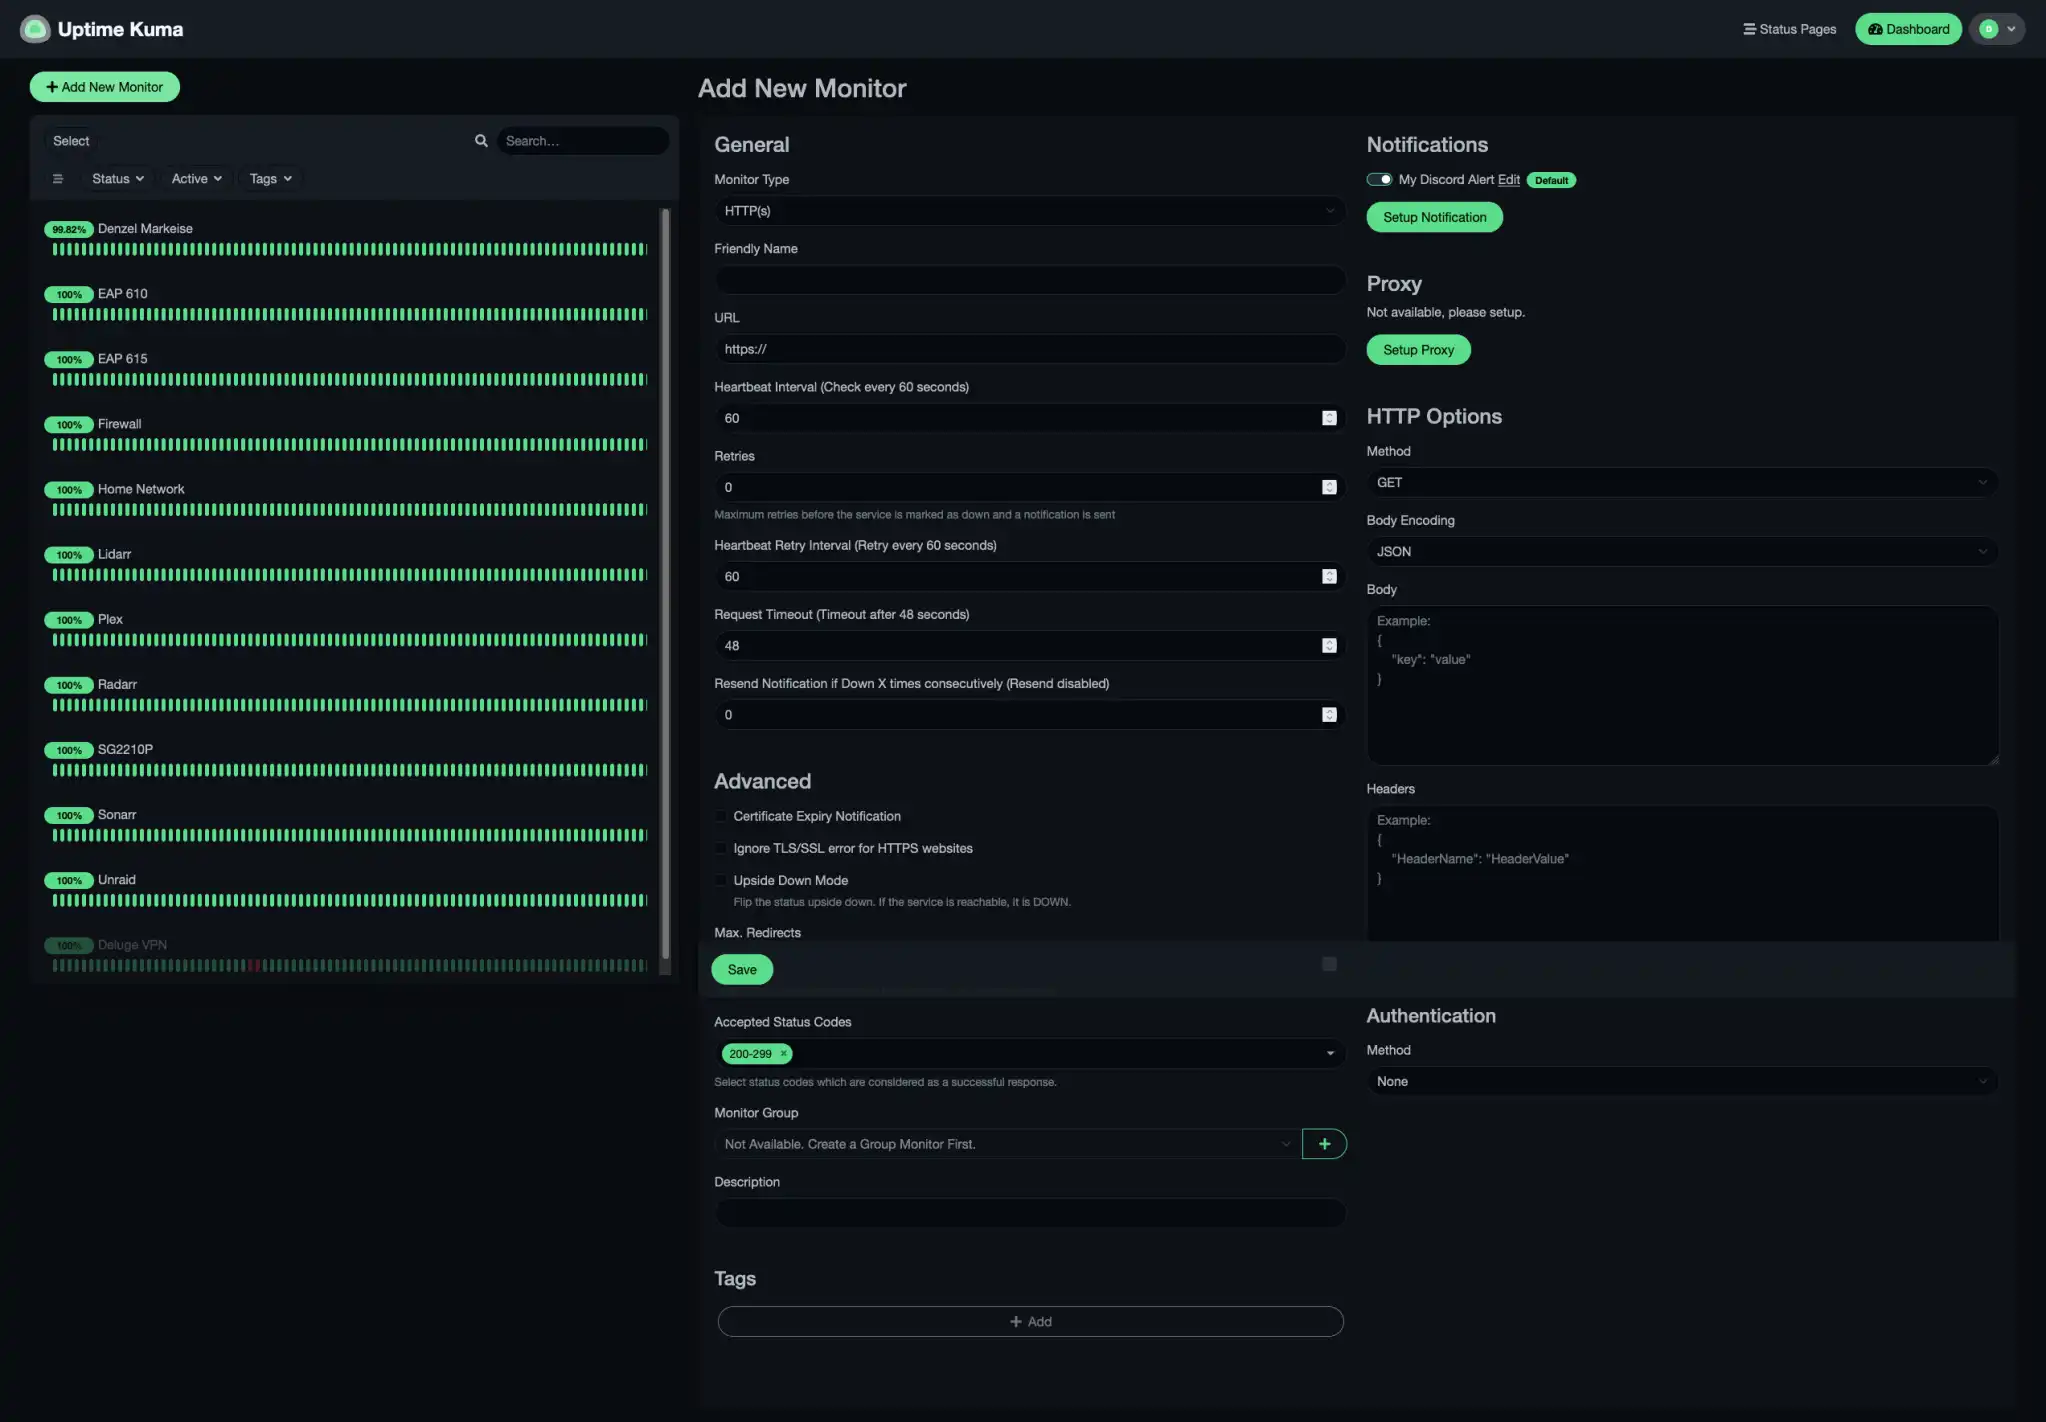
Add a New Monitor:
Go to the Uptime Kuma dashboard and click on Add New Monitor.
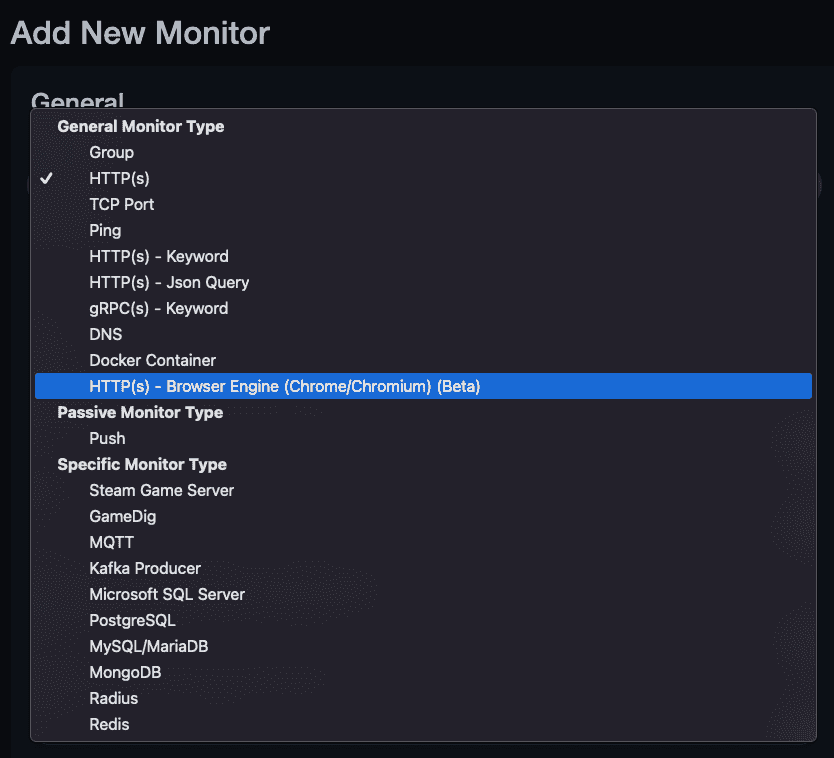
Select HTTP(s) from the list of monitor types.
Configure the Monitor:
URL: Enter the URL of your website (e.g., https://www.example.com).
Interval: Set the check interval (e.g., every 5 minutes).
Method: Choose the HTTP method (GET, POST, etc.).
Expect Status: Define the expected HTTP status code (e.g., 200 for a successful request).
Save and Monitor:
Click Save to start monitoring the website. Uptime Kuma will now regularly check the availability and response time of your site, alerting you if it goes down.
Monitoring TCP Services
For network services that communicate over TCP (such as SSH, FTP, or custom applications), you can set up TCP monitors.
Example:
Add a New Monitor:
Click on Add New Monitor in the Uptime Kuma dashboard.
Select TCP from the monitor types.
Configure the Monitor:
Host: Enter the IP address or hostname of the server (e.g., 192.168.1.100).
Port: Specify the port number (e.g., 22 for SSH).
Interval: Set how often the check should be performed (e.g., every 10 minutes).
Save and Monitor:
Click Save to start monitoring the TCP service. Uptime Kuma will attempt to connect to the specified port and notify you if it becomes unreachable.
Monitoring Ping (ICMP)
Ping monitors are useful for checking the general availability and latency of devices on your network, such as routers, switches, and servers.
Example:
Add a New Monitor:
Go to the Uptime Kuma dashboard and click Add New Monitor
Select Ping from the list of monitor types.
Configure the Monitor:
Host: Enter the IP address or hostname of the device you want to ping (e.g., 192.168.1.1 for a router).
Interval: Set the check interval (e.g., every 1 minute).
Save and Monitor:
Click Save to start the ping monitor. Uptime Kuma will send regular ping requests to the device and alert you if it doesn’t respond.
Monitoring Custom Services
Uptime Kuma allows you to monitor custom services using different protocols, ensuring you can keep an eye on any specific applications or services critical to your operations.
Example:
Add a New Monitor:
Click on Add New Monitor in the Uptime Kuma dashboard.
Select the appropriate monitor type (e.g., DNS, Push, Steam Game Server, etc.).
Configure the Monitor:
Fill in the necessary details based on the service type. For example, for a DNS monitor, enter the domain name and the expected IP address.
Save and Monitor:
Click Save to begin monitoring. Uptime Kuma will check the specified service according to your configuration and notify you of any issues.
Alerts and Notifications
To ensure you are always informed of any issues, Uptime Kuma supports various notification methods, including email, Slack, and webhooks.
Setting Up Notifications:
Go to Settings:
In the Uptime Kuma dashboard, navigate to Settings and select Notification.
Choose a Notification Method:
Select your preferred method (e.g., Email, Slack, Webhook).
Configure the necessary settings (e.g., SMTP server for email, webhook URL for Slack).
Save and Test:
Save the notification settings and test to ensure you receive alerts.
By customizing your monitoring setup with Uptime Kuma, you can keep a close watch on the critical components of your home or small business network, ensuring everything runs smoothly and efficiently.
Follow the instructions within the Uptime Kuma dashboard to configure these monitors and enjoy peace of mind knowing you’ll be alerted to any issues promptly.
Conclusion
You’ve successfully deployed Uptime Kuma on Docker, enabling easy monitoring of your home network services. Whether you’re keeping an eye on your servers, switches, or network storage, Uptime Kuma provides a reliable solution with minimal setup.
Integrating Uptime Kuma into your home or small business setup demonstrates your proactive approach to managing and monitoring your digital environment, enhancing your network’s reliability and performance.
Start using Uptime Kuma today and keep your network running smoothly!