
I didn’t plan to become that guy—the one with dashboards for everything. But here we are. It all started with a simple question: How’s my server doing? Not just “Is it up?” but really—how’s it feeling?
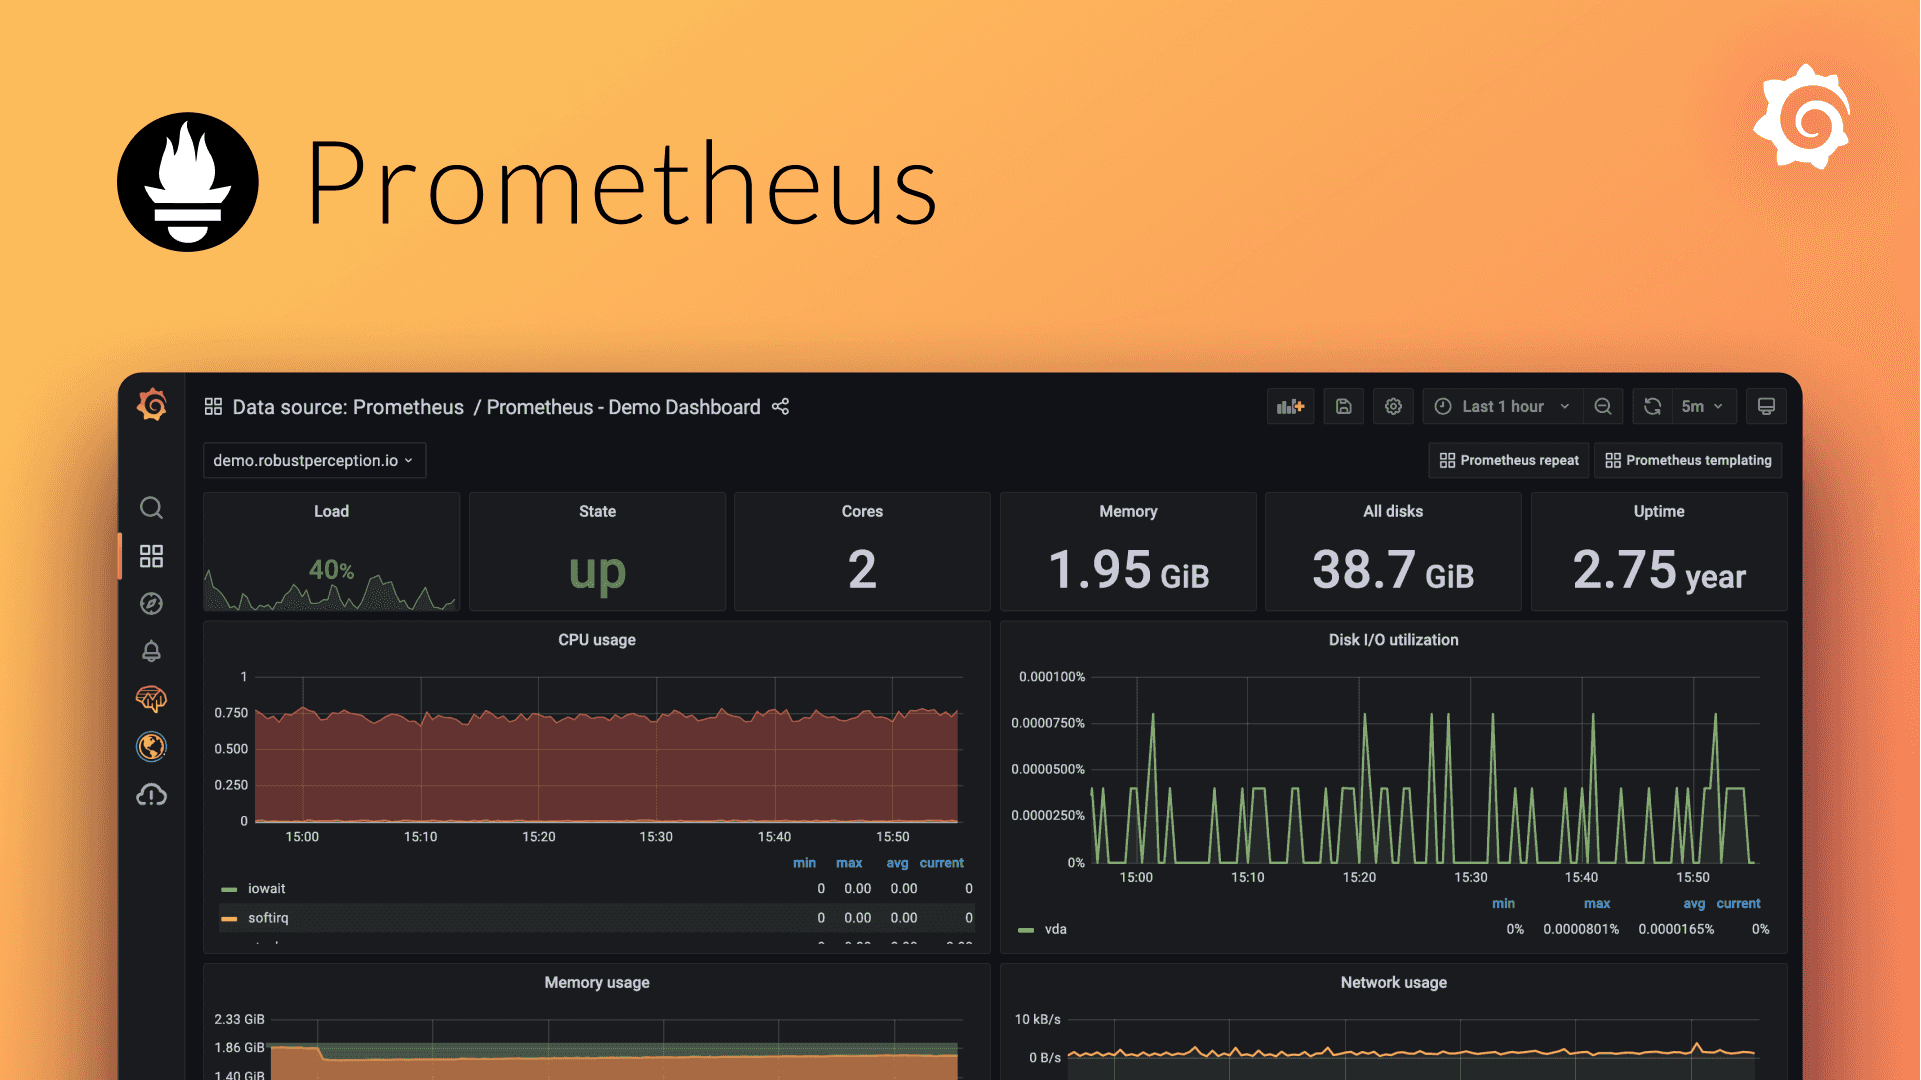
That’s when I fell down the rabbit hole of Prometheus and Grafana. These tools promised to give me answers, beautifully visualized and refreshingly real-time. The problem? I had no idea what I was doing.
Here’s how I stumbled through setting them up on my Unraid server. Hopefully, it helps you avoid some of the facepalms along the way.
Why Even Do This?
I mean, let’s be honest—Unraid already gives you a decent dashboard. But it’s kind of… basic. I wanted something more.Prometheusis is like your data-obsessed friend who tracks everything.
Grafana is their artsy partner who makes it all look good. Together, they give you a window into your server’s soul (and by “soul,” I mean CPU usage).
The Prometheus Setup
Step 1: Install Prometheus
First, I went to Unraid’s Community Apps tab and searched for Prometheus.
Click. Install. Boom. Easy.
But here’s the thing—Prometheus isn’t a “set-it-and-forget-it” kind of deal. It wants you to configure it. Specifically, you need to tell it what to monitor.
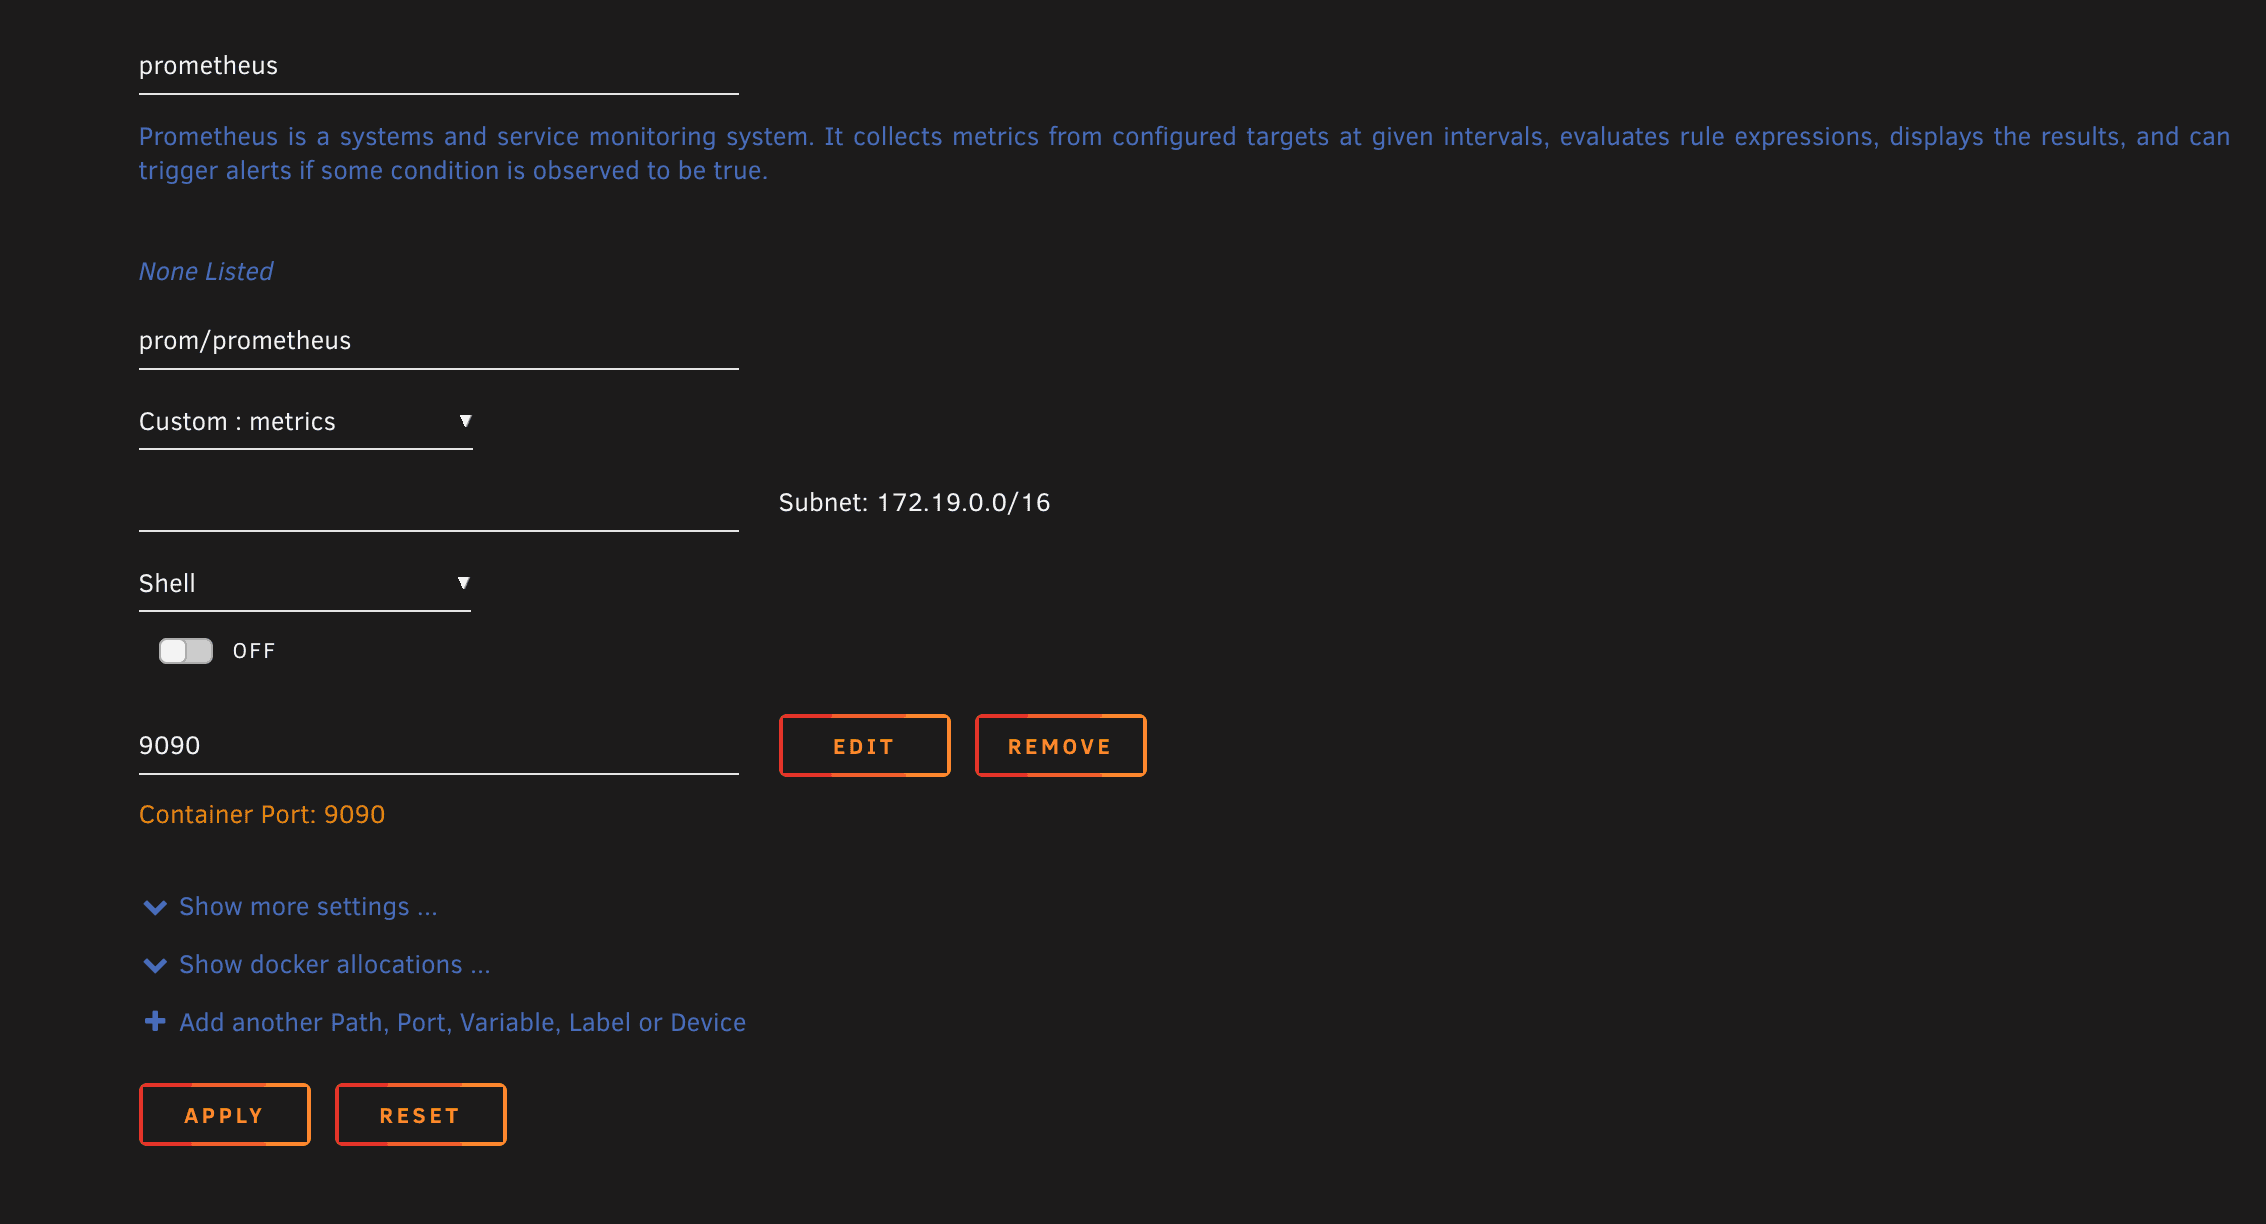
Step 2: Container Info
The network type for both Prometheus and Grafana in Unraid should typically be set to “Bridge” unless you have a specific reason to use another setting. Here’s why:
Host (Not Recommended) Avoid this unless absolutely necessary, as it can create conflicts, especially with Unraid’s use of common ports like 80 and 443.
Bridge (Recommended for Simplicity) This isolates the containers from your host network while still allowing you to assign ports for access. For example:
Prometheus: http://<Unraid_IP>:9090
Grafana: http://<Unraid_IP>:3000
Custom: br0 (Optional for Dedicated IP) If you prefer each container to have its own unique IP on your network (instead of sharing Unraid’s), you can set the network type to Custom: br0 and assign static IPs to Prometheus and Grafana.
This is useful if you want them accessible directly by IP instead of ports.
I’ll create a custom Docker network named metrics on Unraid that allows your Prometheus and Grafana containers to communicate more efficiently, especially since I plan to add more monitoring-related containers in the future.
Here’s how you can create and use a custom network called metrics:
Open a terminal on your Unraid server.
Run the following command to create a Docker network named metrics:
docker network create metrics
Step 3: Node Exporter
Next, we’ll install the Prometheus Node Exporter from the Apps tab.
I tried grabbing the pre-written .yml code from Unraid’s Prometheus blog, but for some reason, it wouldn’t download.
So, I ended up just recreating it myself in VS Code. Here’s what I came up with:
global:
  scrape_interval: 15s # By default, scrape targets every 15 seconds.
  # Attach these labels to any time series or alerts when communicating with
  # external systems (federation, remote storage, Alertmanager).
  external_labels:
    monitor: 'monitor'
# A scrape configuration containing exactly one endpoint to scrape:
# Here it's Prometheus itself.
scrape_configs:
  # The job name is added as a label `job=<job_name>` to any timeseries scraped from this config.
  - job_name: 'prometheus'
    # Override the global default and scrape targets from this job every 15 seconds.
    scrape_interval: 15s
    static_configs:
      - targets: ["localhost:9090"]
      - targets: ["yourUnRAIDIP:9100"] # Your unRAID IP:PORT
You copied it? Nice.
Now, let’s update it. Find where it says yourunraidip and replace it with your Unraid server’s actual IP address.
Now save this, and let’s go to Shares on your current Unraid dashboard.
Open the Appdata folder, then go to the Prometheus directory, and upload the .yml file we just edited.
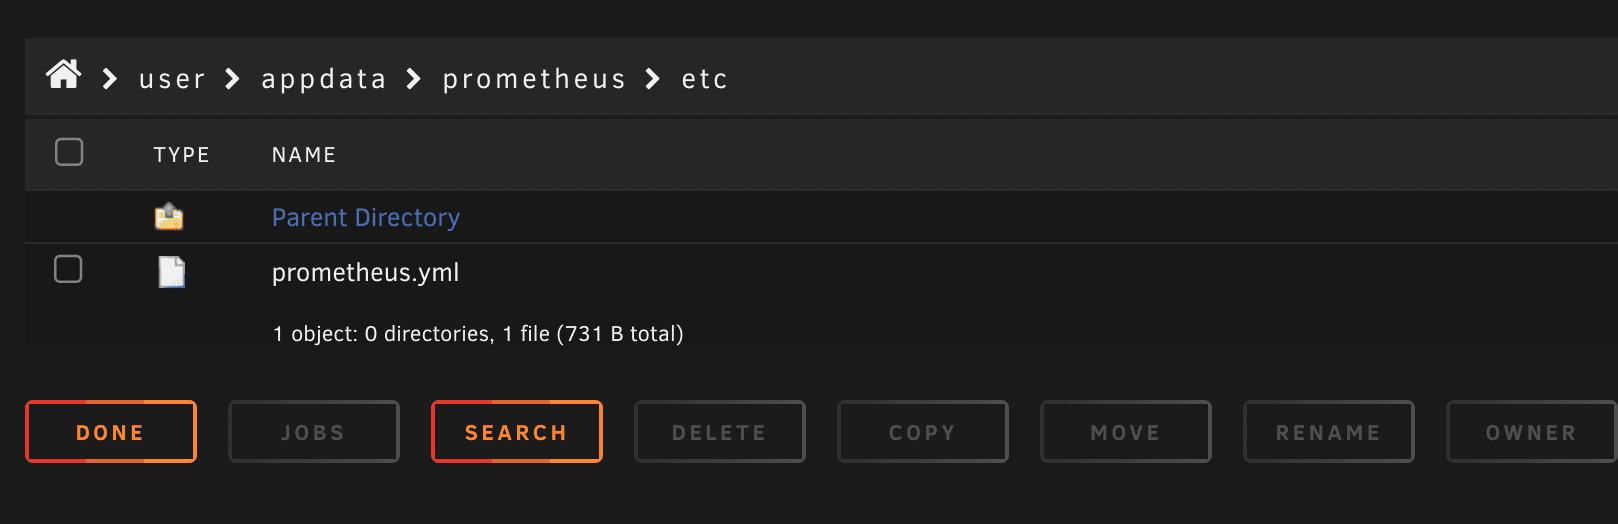
Once that’s done, head back to Docker and start Prometheus.
Now, let’s open the Prometheus WebUI. Head to Status, then Targets. You should see your Unraid IP listed with a status of UP
Grafana: Making It Pretty
Step 1: Install Grafana
Same story as before—Community Apps, search for Grafana “Official”, and install it. I mapped its data to /mnt/user/appdata/grafana and assigned it a port (I picked 3000) and made sure my Network Type is on custom : metrics.
Also, we need to change Key 1 to our server name http://yourserverip
Now for the fun part: turning raw data into sexy graphs.
Step 2: Connect Prometheus to Grafana
Logging into Grafana for the first time felt like opening a blank canvas.
It was daunting but exciting.
By default, the username and password will both be set to “admin.” Go ahead and change your password to something more secure.
If you’re like me, a ridiculously strong 26-character password with a mix of numbers, letters, and special characters will do just fine.
Now that we’re in, let’s go to Data Sources and select Prometheus.
We’ll leave everything as is, but change the Connection to your Prometheus IP—this will be your server IP followed by port 9090. Then, scroll down and hit Save & Test.
You should see “Successfully queried the Prometheus API.” if everything is set up correctly.
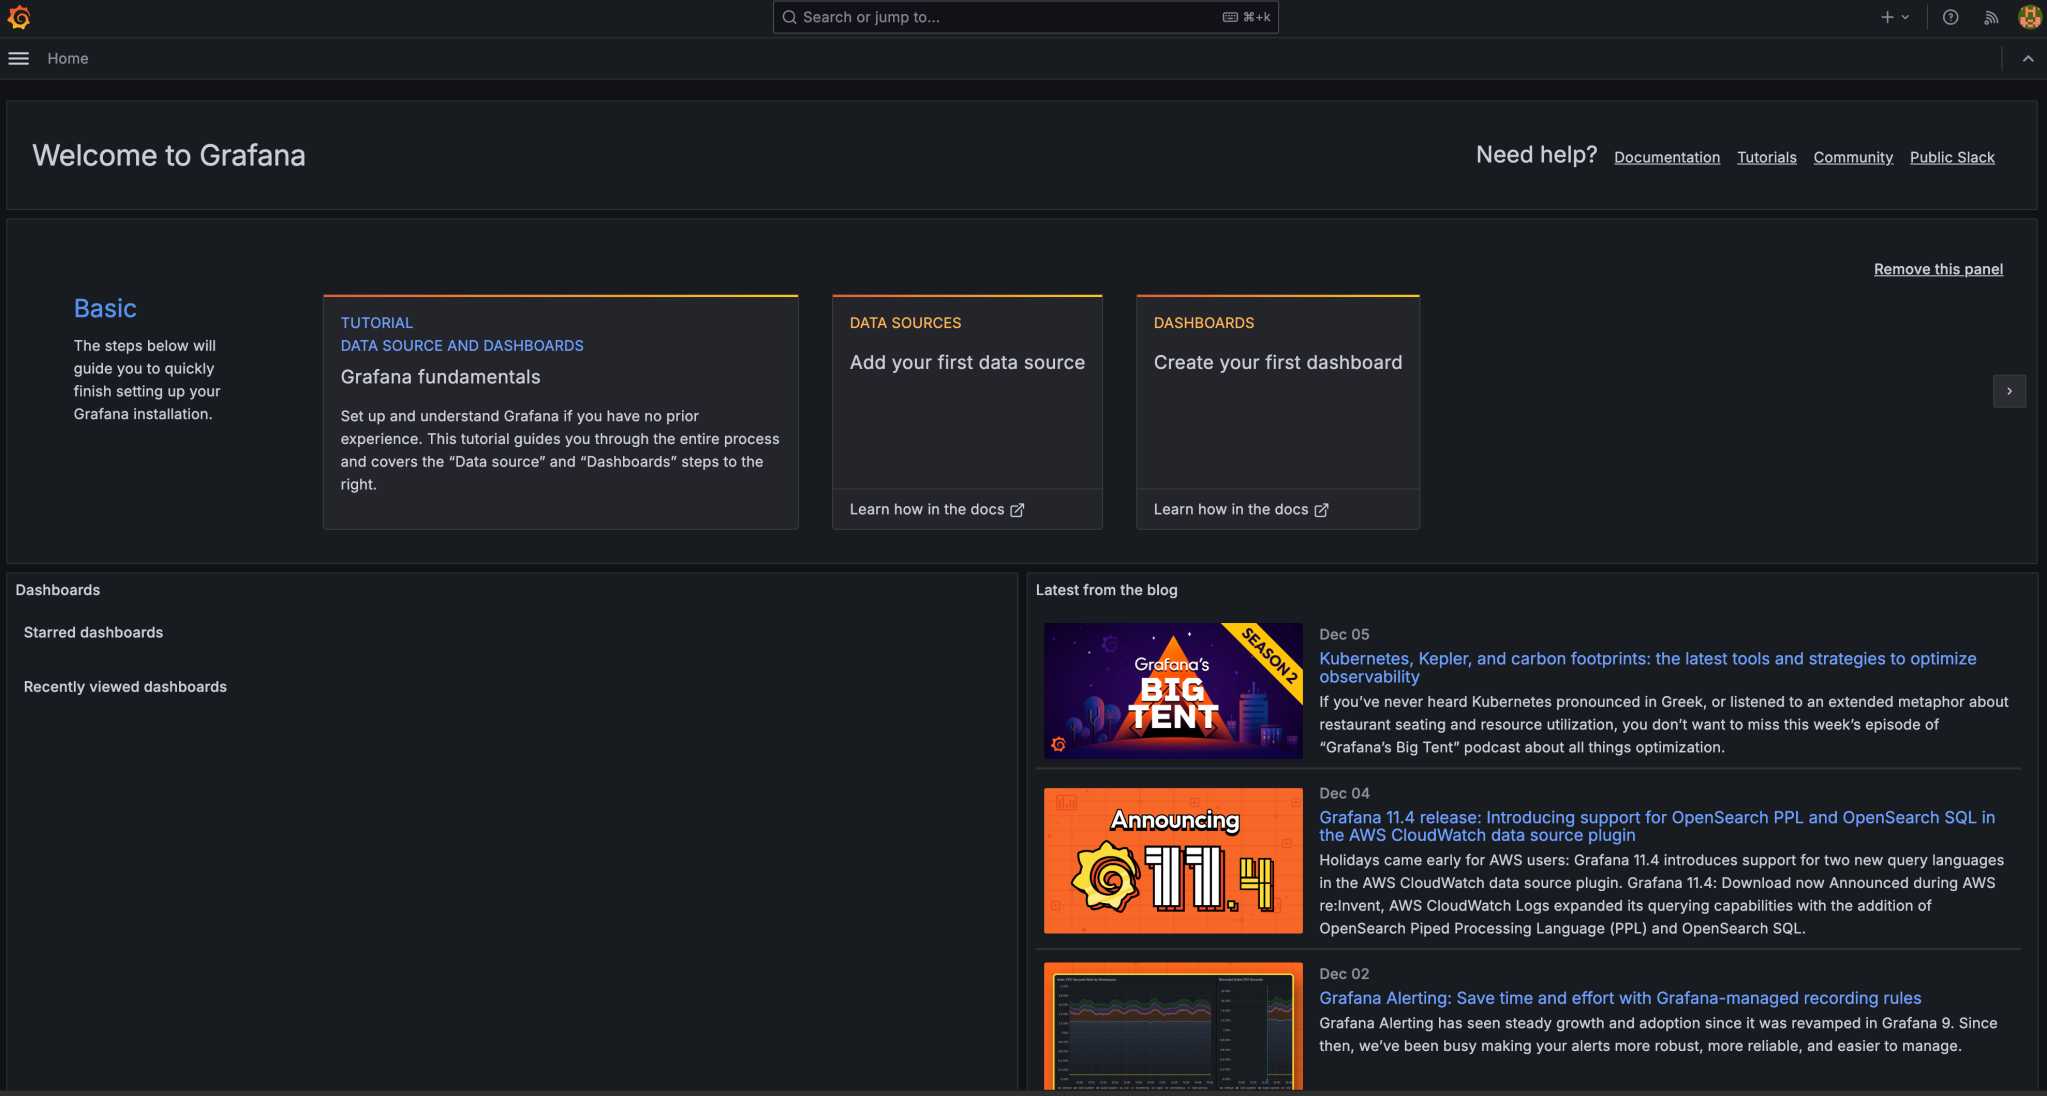
Now, if you scroll back up, you’ll see the Dashboards section (don’t click it!), which contains some basic dashboards.
But we’re not basic, so let’s go for the FIRE dashboards, because why settle for less, right? 😎
Instead of clicking on Dashboards, look at the top right and click Build a dashboard.
Now we’ve got OPTIONS!
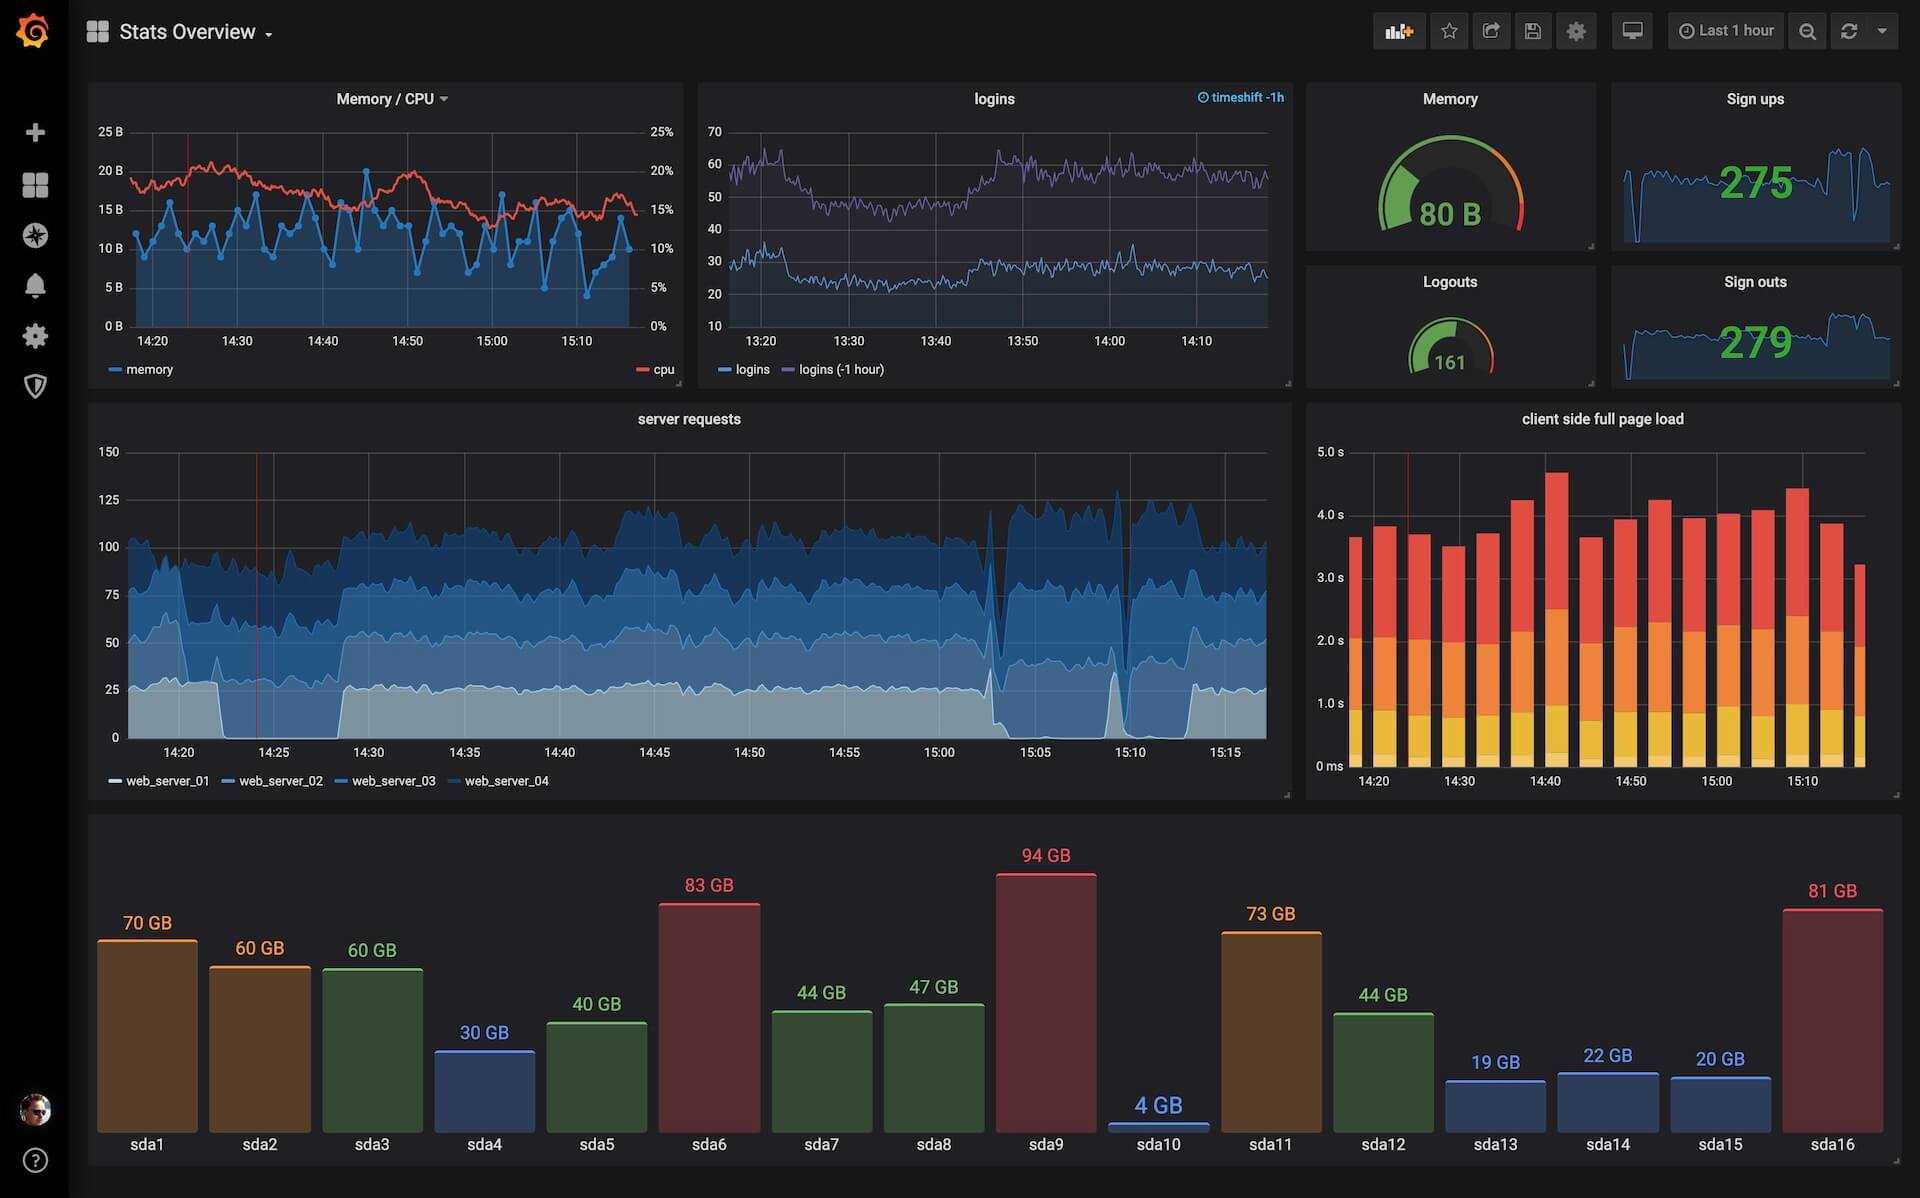
Click Import a dashboard, select No for saving, and enter 1860.
Click Load, then scroll to the bottom and select Prometheus. Choose Prometheus Default, and then hit Import.
This is a very, very, very nice dashboard, but feel free to explore more online for one that fits your specific style.